Data Sampling
What Is Sampling Data?
Data sampling is a statistical analysis technique used to select, process, and analyze a representative subset of a population. It is also used to identify patterns and extrapolate trends in an overall population.

With data sampling, researchers, data scientists, predictive modelers, and other data analysts can use a smaller, more manageable amount of data to build and run analytical models.
This allows them to more quickly produce accurate findings from a statistical population. For example, if a researcher wants to determine the most popular fruit in a country with a population of 100 million people, they would select a representative sample of N (e.g., 1000, 10,000).
| Key Data Sampling Terms Population A population is a set of elements that possess a common characteristic defined by the researcher’s sampling criteria for making inferences. Elements A sampling element is the unit of analysis or case in a population that is being measured, which can be people, objects, or data points (e.g., zip code). Sample A sample is the subset of a population. It is always less than the total size of the population from which it is selected or a smaller number within the population that represents the whole. |
Let’s jump in and learn:
Data Sampling Methods
There are many data sampling methods, each with characteristics suited for the type of datasets, disciplines, and varied research objectives. Data sampling methods are divided into two categories-probability and non-probability sampling.
Probability vs. Non-Probability Sampling Methods
Probability sampling, also known as random sampling, uses randomization instead of deliberate choice for sample selections. Conversely, with non-probability sampling techniques, sample selections are made based on research objectives.
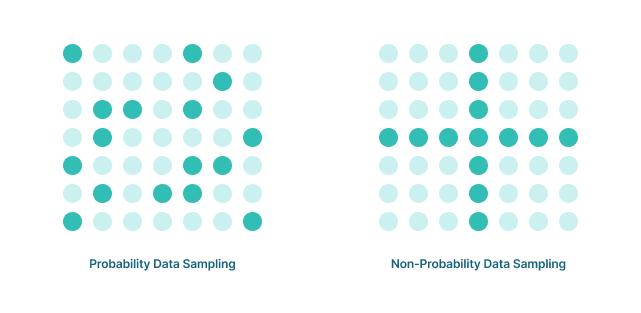
Probability Data Sampling
Probability data sampling uses random numbers that correspond to points in a dataset. This ensures that there is no correlation between sample selections. With probability sampling, samples are chosen from a larger population to suit various statistical methods.
Probability data sampling is the best approach when the objective is to create a sample that accurately represents the population. Types of probability data sampling include the following:
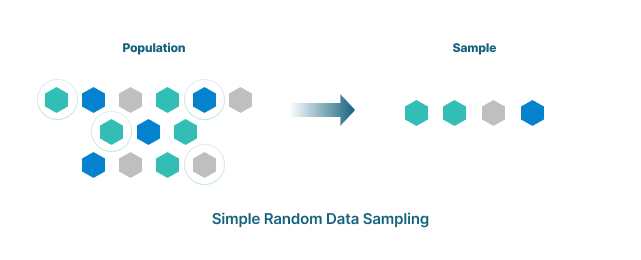
Simple Random Sampling
Gives every element in the dataset an equal probability of being selected. It is often done by anonymizing the population. For instance, the population can be anonymized by assigning elements in the population a number and then picking numbers at random.
Software is usually used for simple random sampling. The benefits of simple random sampling are that it can be done easily and inexpensively, and it removes bias from the sampling process. A limitation of simple random sampling is unrepresentative groupings, because researchers do not have control over the sample selection.
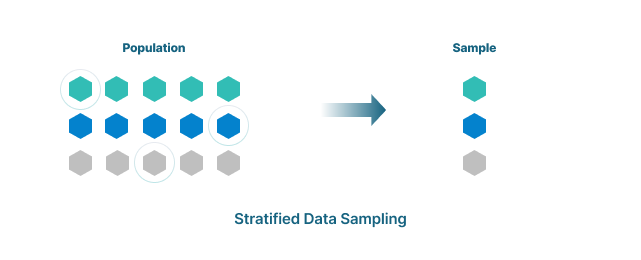
Stratified Sampling
Used when researchers require groups based on a common factor. The strata, or elements within the subgroups, are either homogeneous or heterogeneous. With stratified sampling, all elements of the population are represented as samples and are pulled from the different strata (e.g., when studying commute patterns, separating people who take public transportation, walk, bike, or drive). However, the process of classifying the population introduces bias.
Cluster Sampling
Divides datasets into subsets, or clusters, according to a defined factor. Then, samples are randomly selected. With cluster sampling, groups (e.g., people living in a particular city, people born in a certain year) rather than individual elements are randomly selected.
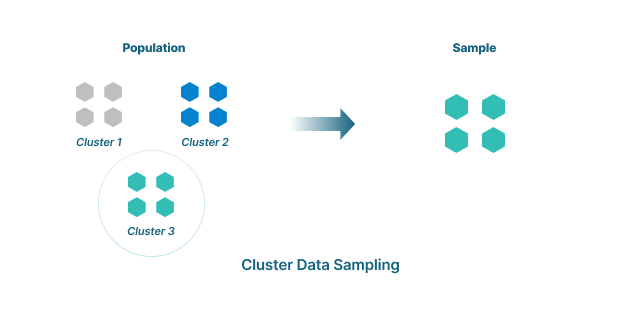
A more complicated variation of customer sampling is multistage sampling. This method separates clusters based on different criteria then samples this subset. This can be done any number of times.
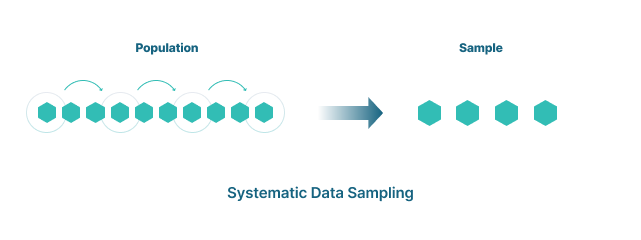
Systematic Sampling or Systematic Clustering
Systematic sampling, or systematic clustering, creates samples by setting an interval at which to extract data from the dataset according to a predetermined rule. With systematic sampling or clustering, the element of randomness in selections only applies to the first item selected. After that, the rule dictates the selections. An example of systematic sampling or clustering would be creating a 100 element sample by selecting every 10th row of a 1000 row dataset.
Probability Data Sampling
With non-probability sampling, the sample is identified and extracted based on researchers’ or analysts’ subjective judgment. A limitation of non-probability data sampling is that it can be subject to bias and may not accurately represent a larger population.
Non-probability data sampling is used when expediency or simplicity are required. Types of non-probability sampling include the following.
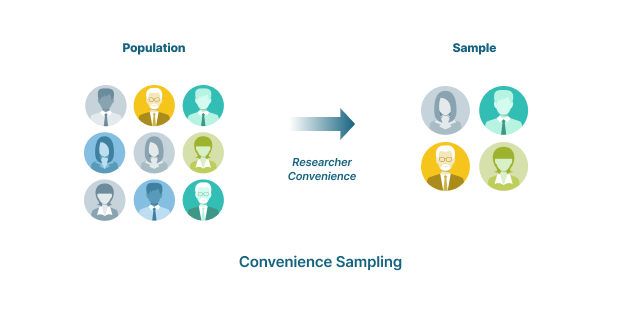
Convenience Sampling
Collects data from an easily-accessible and available group. For example, convenience sampling would be done by asking people outside of a store to take a survey. The collected elements are based on accessibility and availability.
Convenience sampling is often used as a preliminary step. With convenience sampling, significant bias will be introduced.
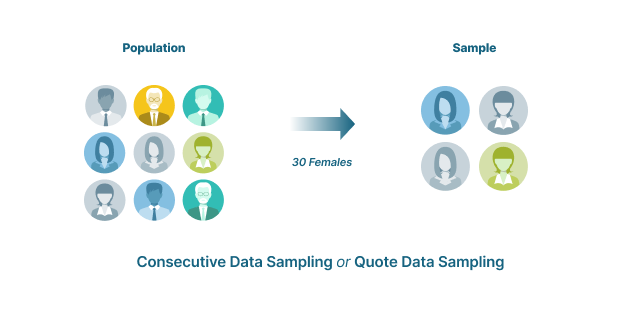
Consecutive Sampling or Quota Sampling
Gathers data from sources that meet the criteria until the desired sample size is attained. This method ensures equal representation in subsets within the sample. With consecutive or quota sampling, the proportion of the sample does not match the proportion of the group to the population.
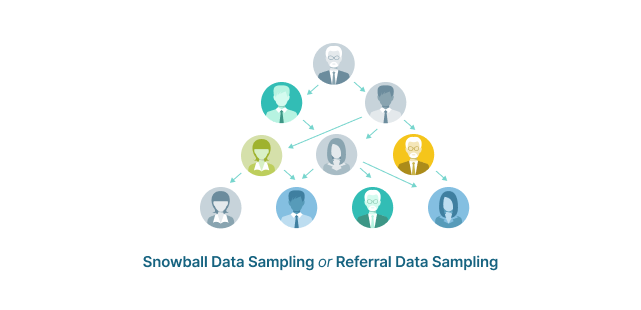
Snowball Sampling or Referral Sampling
Collects elements for the dataset by gathering those that are related, in essence getting help from the existing elements to refer to the others as samples that fit in the population—for instance, gathering a small group then asking them to invite friends to join.
Snowball sampling or referral sampling is used when the population is unknown, and it is difficult to build a dataset. Because it is based on referrals, the chance of bias is increased.
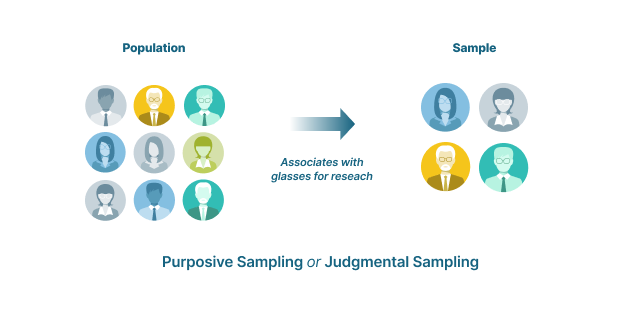
Purposive Sampling or Judgmental Sampling
Selects the sample based on predefined criteria established by the researcher according to the purpose of the research. Participants are selected based on their understanding of the research question. This method is unlikely to produce a representative sample, but allows researchers to easily and quickly gather a range of informed responses.
Populations vs. Samples
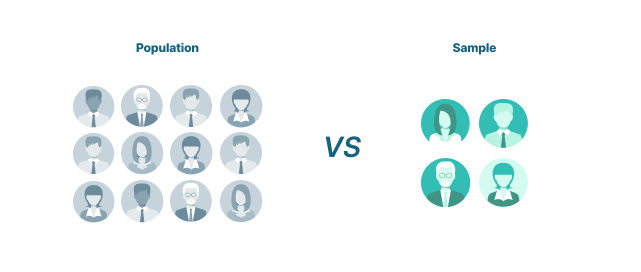
A population and sample are at the crux of data sampling.
A population is a complete set of elements that possess standard criteria between them. In terms of data sampling, a population does not have to be exclusively people. It can be any data type that shares a trait, including events, organizations, or a set of items.
A sample is a subset of a population. It is representative of the overall population. With data sampling, the sample is used to research the characteristics or behavior of the population.
Samples are created using probability sampling and non-probability data sampling methods.
Quick Comparison of Population and Sample in Data Sampling
| Population | Sample |
| The measurable quality is called a parameter. The population is the complete set of data. Reports are an accurate representation of results. | The measurable quality is called a statistic. The sample is a subset of the population. Reports have a degree of uncertainty. |
Why Data Sampling Is Required for Research
- Offers a representation of the large population that can be analyzed to provide insights into the entire population
- Provides a more manageable set of data
- Allows researchers to conduct analysis and evaluate results more quickly
- Reduces the cost of research and the time required to study a population by limiting the volume of data to be collected and processed
- Enables inferential statistics to infer insights about the entire population
Data Sampling Process
There are a number of data sampling methods. Regardless of which data sampling method is used, it is critical that the samples are the correct size and are collected without bias.
When determining the size of a sample, there are tradeoffs between precision versus time and money. Factors to consider when assessing these tradeoffs include:
- Whether data being sampled is continuous (i.e., data that is counted numerically) or categorical (i.e., put into categories, such as green, blue, male, or female)
- Precision required for statistical inferences
- Estimate of the standard deviation for the population
- Desired confidence level
How to Determine Sample Size
The following steps explain how to determine a suitable sample size for continuous data.
To start, the sample size variables should be considered. This includes the following.
- Population size
- Margin of error and confidence interval (i.e., the estimate ± the margin of error)
- Confidence level (i.e., the required confidence that the actual mean falls within the margin of error)
Note: The most common confidence intervals are 90% confident, 95% confident, and 99% confident. - Standard deviation (i.e., an estimate of how much the responses will vary from each other and from the mean number)
Once the sample size variables have been determined, the sample size can be calculated. Steps to calculate the sample size are as follows.
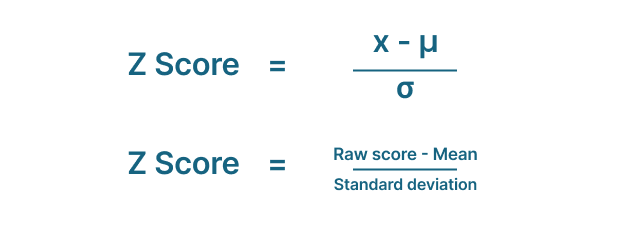
- Turn the confidence level into a Z-score (i.e., a common statistical way of standardizing data on one scale so a comparison can take place). Z-scores for the most common confidence levels are:
- 90% – Z Score = 1.645
- 95% – Z Score = 1.96
- 99% – Z Score = 2.576
The formula used to calculate a Z-score is:
- Use the sample size formula to make the calculation.

- n: necessary sample size
- Z: Z-score
- p: standard deviation
- e: margin of error
Common Data Sampling Errors
Data sampling error is the deviation between the estimate of an ideal sample and the actual population. Data sampling is meant to create samples that are a representative subset of the population, with the sample mean being equal to the mean of the population.
A sampling error occurs when that is not achieved and is due to uncertainty inherent in natural systems. There are two types of uncertainty in any system, epistemic uncertainty (expected error because of a lack of data) and aleatoric uncertainty (unpredictable error inherent in the natural world).
While researchers can’t do much about aleatoric uncertainty by definition, they can acknowledge it's presence in models and try to reduce epistemic uncertainty as much as possible. The first step is understanding the types of sampling errors common in research.
Types of Sampling Errors
- Population-specific errors
Occurs when a researcher does not understand who to survey - Selection error
Occurs when only those participants who are interested in the survey respond to the questions - Sample frame error
Occurs when a sample is selected from the wrong population data - Non-response error
Occurs when a useful response is not obtained, because researchers were unable to contact potential respondents, or potential respondents refused to respond
Data Sampling Bias
Related to data sampling errors is sampling bias caused by the way in which samples are collected. This can result in elements of a population having less or more sampling probability than the others. Types of data sampling bias include:
- Response bias
Occurs during data collection when a respondent or participant gives inaccurate or false answers to a question - Voluntary response bias
Occurs when individuals are self-selected or choose to participate - Non-response bias
Occurs when participants do not respond in whole or part - Convenience bias
Occurs when a sample is taken from individuals that are conveniently available
Three Ways to Eliminate Data Sampling Errors
1. Increase the sample size
2. Take the same measurements repeatedly, using more than one subject or multiple groups
3. Use random data sampling to establish a systematic approach to selecting a sample
Advantages of Data Sampling
Among the many advantages of data sampling are the following.
- Expand research capacity
- Gather intensive and exhaustive data
- Improve the accuracy of data
- Increase rapport between researchers and subjects
- Lower cost to gather information about a population
- Minimize the research scope
- Reduce impact on research organization’s resources (e.g., people, systems)
- Save time conducting research
Data Sampling Challenges
The primary data sampling challenges result from difficulties and errors in the selection, estimation, and administration of samples. Among the challenges are the following.
- Difficulty selecting representative samples
- Disparity of units within the population
- Inability to gather a large enough population to derive a derivative sample
- Inadequate knowledge about the subject being researched
- Lack of participation within the selected sample
- Susceptibility to bias—both in the selection of data sampling method and sample
Regardless of the cause of the data sampling challenge, the result can be inaccurate data collection and erroneous conclusions.
Data Sampling FAQ
What are the types of data sampling techniques?
The two main categories of data sampling techniques are probability sampling and non-probability sampling.
What methodologies are used for probability data sampling?
Probability data sampling methodologies include simple random sampling, stratified sampling, cluster sampling, multistage sampling, and systematic sampling or systematic clustering.
What methodologies are used for non-probability data sampling?
Non-probability data sampling methodologies include convenience sampling, consecutive sampling or quota sampling, snowball sampling or referral sampling, and purposive sampling or judgmental sampling.
What is meant by sampling error?
Data sampling errors are statistical errors. They occur when a sample does not accurately represent the population.
What are the types of sampling errors?
The main types of data sampling errors are population-specific error, selection error, sample frame error, and non-response error. Bias is also sometimes considered a type of data sampling error.
What are the main types of data sampling bias?
The four most common types of data sampling bias are response bias, voluntary response bias, non-response bias, and convenience bias.
What happens if there are data sampling errors?
Data sampling errors can lead to inaccurate data collection, which results in erroneous results that could compromise the integrity of a research project
How can data sampling errors be minimized?
To minimize the risk of data sampling errors, the sample size can be increased, measurements can be taken multiple times, or random selection can be used to create the sample.
What information is needed to calculate the correct sample size?
Calculations to determine the right sample size use the necessary sample size, standard deviation, margin of error, and Z-score.
Data Sampling—A Research Cornerstone
Data sampling plays a crucial role in determining the validity of an outcome in statistical analysis. By understanding how data sampling works, more accurate results can be achieved more efficiently.
With a variety of techniques that are fine-tuned to specific use cases, data sampling is a proven method for studying large populations. Done correctly, data sampling is a powerful tool that allows researchers to work with datasets of all sizes and types to derive meaningful insights
Egnyte has experts ready to answer your questions. For more than a decade, Egnyte has helped more than 16,000 customers with millions of customers worldwide.
Last Updated: 19th April, 2022