Debugging Performance Issues in Distributed Systems
Debugging performance issues across distributed systems is a difficult task, and debugging data-driven performance issues is an even bigger challenge due to the anomalies that can be buried under millions of requests. Sometimes, it’s like finding a needle in haystack.
We use a service-oriented architecture and have multiple services that handle different parts of Egnyte’s distributed stack. For example, one service handles the upload/download of files, one handles authentication of requests, and another handles document preview. In a distributed system, it means some requests can flow to multiple services and contact multiple cache/databases before it’s finally served. A typical request flow looks like the image below:
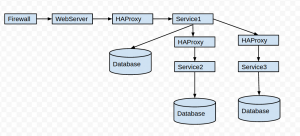
As you can see from above image, the request is flowing to multiple systems. But, if and when the request fails, conducting root-cause analysis can be a daunting task. To make the debugging task easy at Egnyte, we leverage various tools and strategies and take a proactive approach to finding and fixing functional and performance issues before it impacts customers. Some of the strategies/tools we use include:
- Request Fingerprinting
- Logstash
- APM Tools for Anomaly Detection
- Query Fingerprinting
- Scribe
Request FingerprintingThe first rule of debugging distributed systems is to fingerprint the request as early as possible in the request flow. For this, we generate a unique requestID after the request is served from the first layer of Web servers. We then inject this requestID as a request header in the http request.Each system in the architecture will then implement some cross-cutting way of logging this requestID in the logs. For Java, we wrote a servlet filter that runs on all urls and injects the requestID in slf4j logging context, and then in log4j.xml, we added R-%X{MDC_REQUEST_ID} in a pattern layout to log it for every message.
Logstash
Even with the above steps, debugging an issue would require you to grep logs from multiple machines. In a high availability configuration, any node can serve the request. This is where Logstash comes into the picture. Logs from log4j are sent to syslog, in addition to being sent to local log files. Logstash will combine the incoming logs from multiple systems, and now an engineer can run a kibana query on the requestID, such as @fields.requestID:"VBIchcCoAisAAAguXA4AAAFD", to see logs from all nodes for this request. Here’s a screenshot of what the output of the Logstash query would look like:

APM Tools
APM tools have came a long way in last five years. APM tools are great at detecting anomalies (i.e., data driven performance issues and load spikes). There have been several “Aha! moments” in the past few months; for example, I found a select 1 from dual query being executed at 50K per minute in one Pod - highlighted below.
We found out that our database connection pooling library was validating the connection before each query, even though it was reused a millisecond ago. The solution was to replace commons-dbcp with tomcat-dbcp, which would validate only if the connection is idle for a configured duration.
APM tools are also good at detecting anomalies. We noticed that the average response time for this API call is 40ms, but once in a blue moon, it would take 4 seconds.
For security reasons, all query parameters are obfuscated and request parameters are suppressed, so it’s very difficult to find out what happened and who made the call. Most of these responses would be caused by data-driven performance issues.
Query FingerprintingUsing APM tools, we can figure out that a particular query is taking 2 sec, for example. However, if you ask Database Administrators (DBAs), then that query wouldn’t appear in slow query logs because it is below the slow query threshold.Normally, the same query takes only 10ms, but due to the data-driven issue, it can take 2 sec. Whenever DBAs see a query taking time in the APM tool, they wouldn’t know which of the hundreds of database servers would receive the query. This is a common complaint, and it is even more painful to track it down when the query data won’t show up in slow query logs. For me personally, it was difficult to know what the original request was. This is where query fingerprinting comes handy.Using aspect-oriented programming, I wrote an interceptor that would append a comment with the format /*appNodeIdentifier requestID queryName dbIdentifier*/ at the end of the query. Due to obfuscation, it would appear as:
With this interceptor, DBAs now know the address of the server this query went to, and engineers receive the requestID. Using this requestID, now we can query Logstash and find out exactly what happened.Recently, I ran into a data-driven performance issue where for 99% of the time, the ListFolder API would take 40ms, but for one requestID, it took 3sec. I went and checked Logstash using RequestID, and I saw that the customer had 25K files in one folder, and loading those from database/memcached was taking a much longer time. The action item for us was to tune the ListFolder API for larger folders.One thing to note - with query fingerprinting, you have to be careful because in some databases, it invalidates query cache as each query is unique due to the requestID in the query comment. For MySQL, we had to turn this parameter (query_cache_strip_comments) ON, since it’s OFF by default . See more details about the query_cache_strip_comments parameter here.ScribeWe wrote an exception monitoring system where each application server would catch exceptions that happened and ship them to a central log server via Scribe. At the end of day, we generate a report that contains exceptions ranked by count.The beauty of this report is that it contains a sample requestID, and clicking on it would open up the entire request chain with all logs that lead to the exception trace. Now, engineers can file a ticket and include the exceptionID. If a regression issue appears, then we can click on the exceptionID to see whether this is a regression or a new issue.
Since the reports are only generated every 12 hours, which could be too late is some cases, we decided to integrate exception monitoring using APM’s custom instrumentation API. This allows us to take a real-time look at exception trends and trace those individual requests.
While debugging distributed systems. we stick to the “Less is more” and “If you cannot measure it, you cannot improve it“ principles. By connecting the dots between the systems, using the right tools and strategies, and making only relevant data available to engineers, we save a ton of engineering time, which allows us to react faster to customer issues.At Egnyte, we strive to improve our production systems daily by taking a proactive approach to both performance and functional issues. Check out our jobs page and contact us at jobs@egnyte.com if you are interested in joining our Performance Engineering team at Egnyte.