
Analyzing Enterprise Spreadsheets With LLMs Without Loading Them Into Context
The Problem
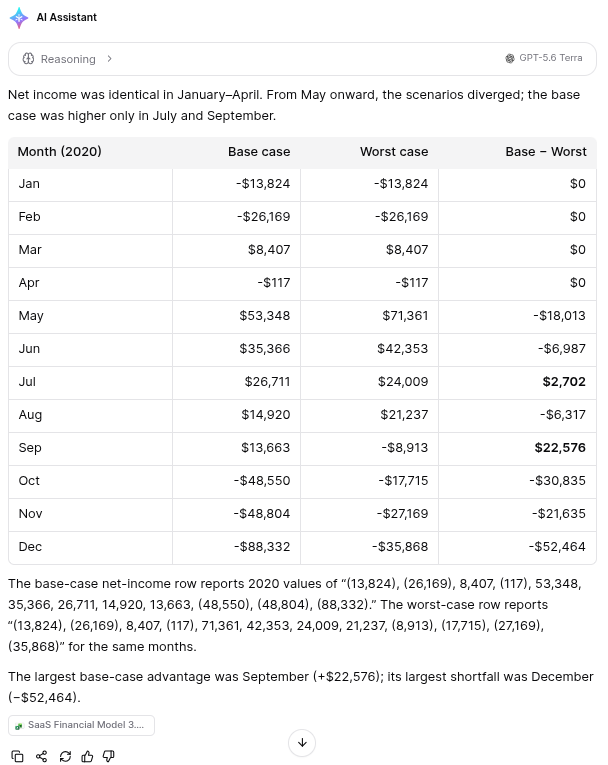
Imagine a user asks the Egnyte AI Assistant: "How does net income compare between the base-case and worst-case scenarios for each month in 2020?"
The file they're referring to is a 10 MB, 20-sheet SaaS financial model with over 50,000 cells. The model has revenue projections, hiring plans across both scenarios, a marketing funnel, monthly SaaS metrics, and actuals exported from the billing system. Metrics run down the rows; months run across the columns. (Download the example file here: Baremetrics SaaS Financial Model 3.0)

The naive approach would be to paste the file contents into the LLM's prompt, but that would fail in three ways.
- Cost: Naively serializing this file's 52,000 non-empty cells across 20 sheets produces roughly 440,000 characters. That’s about 110,000 tokens, and enterprise files with denser content or more sheets can reach ten times that.
- Quality: Frontier models exhibit measurable performance degradation on information-dense tasks as context grows, even within their stated context limits.
- Data exposure: A naive paste sends every cell to the LLM, including salary rows, supplier prices, employee names, regardless of what the question asks. With SQL, only the specific values that answer the query reach the LLM. Exposure is proportional to the answer, not to the file.
So the question becomes:
How do you give an LLM access to a 10 MB spreadsheet without putting a single cell value into its context window?
Recursive Language Models (Zhang et al., 2025) address this by having the LLM decompose and query its own input across multiple context windows. The file content still enters the model, just not all at once. Our approach takes a different position: No slice of the file ever enters the context window. The LLM sees structure and query results, and the data stays in the database.
Why Excel Isn’t a Document
Before getting to the solution, it's worth understanding why Excel breaks standard document RAG approaches, the kind that work well for PDFs and Word documents.
Structure is the data. A cell value of 1200 means nothing without knowing it sits at the intersection of row "Net Income" and column "Apr 2020". Chunking the file into text passages and embedding them destroys this positional information entirely. You end up with fragments like "Net Income 1200 1450 980" with no way to reconstruct which number corresponds to which period.
Layouts are unconstrained. Headers on row 3, data starting row 4, totals interspersed, cross-tab pivots, transposed reports, and no two enterprise files from different authors are structured the same way. You can’t write a parser that assumes a fixed layout and expect it to generalize.
Visual attributes carry semantics. Bold cells are headers or subtotals, not regular data rows. Background colors mark categories, exceptions, or flags. Merged cells spanning multiple columns are group labels. A CSV export silently drops all of this, and with it, a significant portion of the file's meaning.
The right mental model to adopt is: a spreadsheet isn’t a document to be read, instead, it’s a database to be queried. The structure, positions, and formatting are the schema.
Where Spreadsheet Analyst Fits
Spreadsheet Analyst runs as a tool inside the Egnyte AI Assistant, which is built on the ReAct agent loop, where the LLM drives an open-ended tool-calling loop until the task is complete.
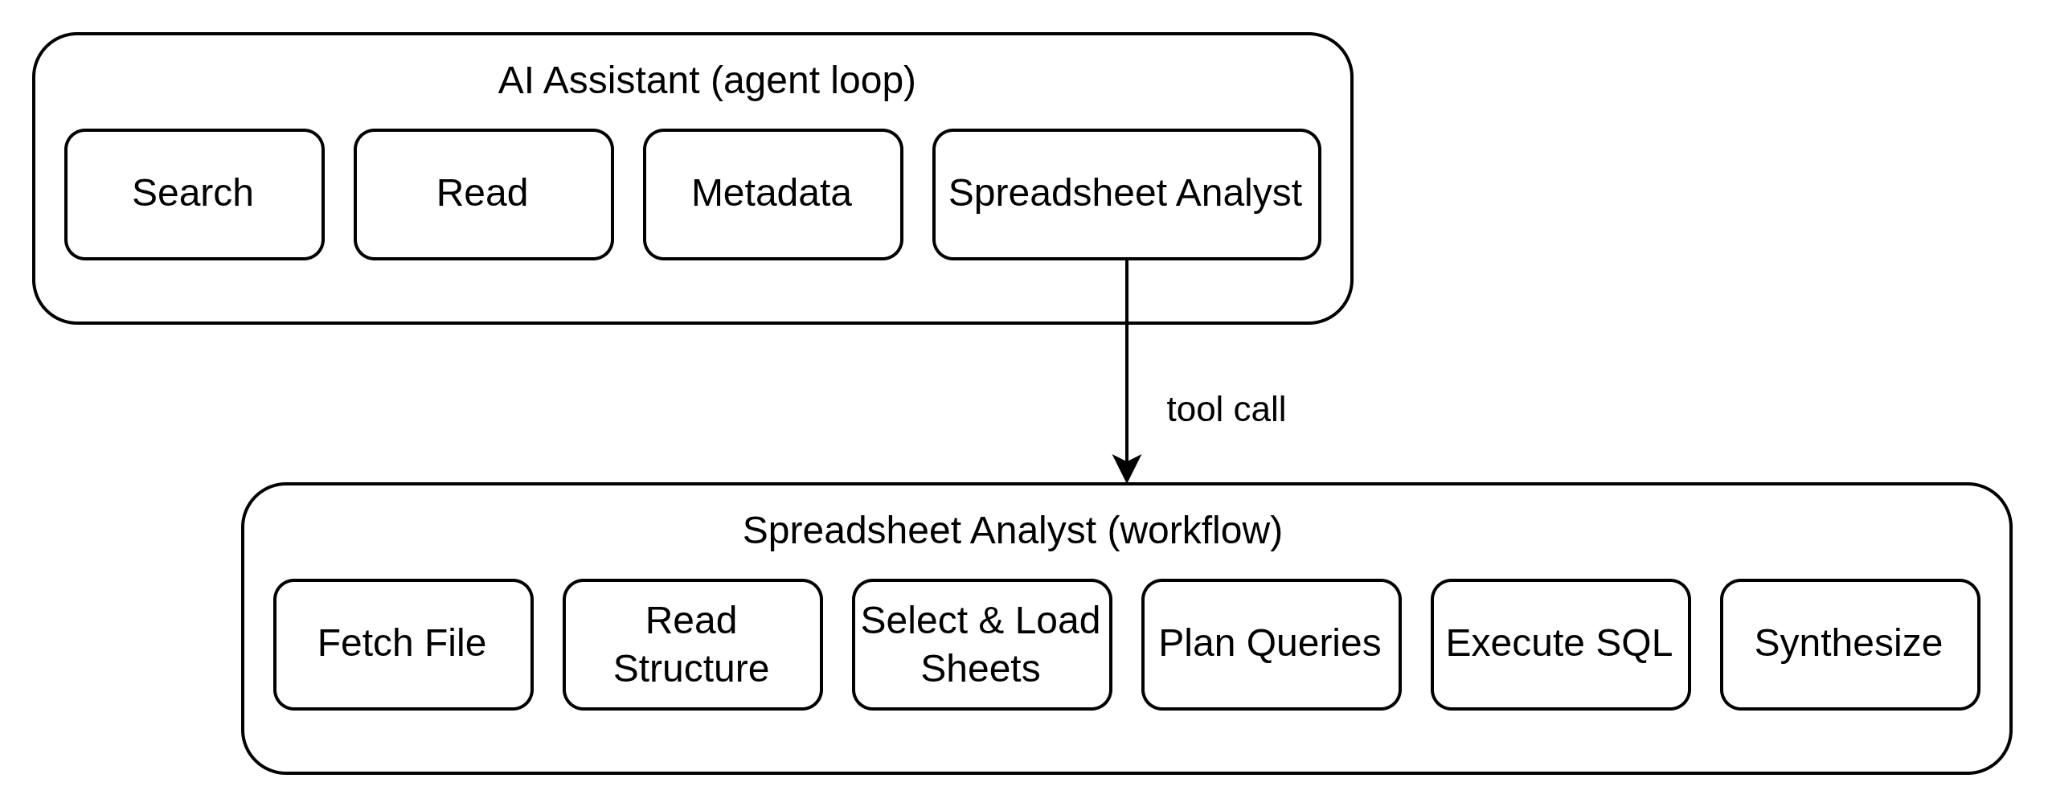
This separation is deliberate. The outer agent handles flexibility; the inner workflow only needs to be fast and reliable. Latency compounds quickly if the inner loop also makes sequential LLM calls. The predefined workflow behaves like a function: deterministic input, bounded execution, structured output.
The Core Idea: Externalize, Don't Embed
The central architectural decision is simple to state:
- Validate the file's size and format.
- Build a workbook map: the name, size, headers and top rows of every sheet.
- For large multi-sheet workbooks, the LLM uses the map to choose which sheets the question needs.
- Parse only those sheets into an in-memory DuckDB table called spreadsheet_cells.
- Give the LLM a structural preview with a schema description and a sample of the data.
- The LLM writes SQL queries against the live table.
- Return query results to the user, and not raw file content.
The LLM is the analyst. DuckDB is the database. The structural preview is the schema documentation.
This has a natural scaling property: the context window contains metadata and a sample, not data. A 500,000-cell file and a 5,000-cell file cost nearly the same prompt tokens, because neither file's cell values are in the prompt.
The EAV Schema: Making Any Spreadsheet Queryable
Why use EAV (Entity-Attribute-Value)? A spreadsheet's column names are unknown at design time. A file about regional sales has different columns than a file about HR headcount, which has different columns from a project budget. A typed schema has revenue FLOAT, region TEXT, quarter TEXT—they would need to be different for every file, making a generalized system impossible.
EAV solves this by making the schema file-agnostic. Instead of each attribute getting its own column, every cell becomes a row and column identity is stored as data rather than as a schema constraint. One table works for any spreadsheet, any layout, any set of column names. The cost is loss of type safety, a single value column stores everything as text, and casting can fail silently on malformed data. The schema addresses this directly: The parser computes four typed representations of every cell at parse time, so the LLM never needs to cast.
Schema
Every cell maps to one row. Four column groups cover everything the LLM needs to write accurate SQL:
- Identity: sheet, row and column position, so the LLM can locate any cell without ambiguity, whatever the layout.
- Value: four typed representations of the cell (raw, numeric, date and normalized text), so the LLM picks the right one for each operation and never needs to cast.
- Formatting: bold, color, italic and hidden flags, so visual attributes can be used as SQL filters.
- Metadata: data type and number format, which carry business meaning beyond the raw value.
A Concrete EAV Query
The SaaS model's Operating Model sheets have metric names running down column A and monthly date headers running across row 1. To find net income for every month in 2020, the LLM writes one query that works in three parts:
- Find the row on the base-case sheet whose normalized text contains "net income".
- Find the columns on the same sheet whose date value falls in 2020.
- Return the date and numeric value of every cell where that row and those columns meet.
This query works regardless of which row "Net Income" is on, which columns the 2020 months are in, or how many sheets the file has. Point it at the worst-case sheet instead and the same query returns the other scenario. The EAV schema absorbs layout variation without requiring a file-specific parser.
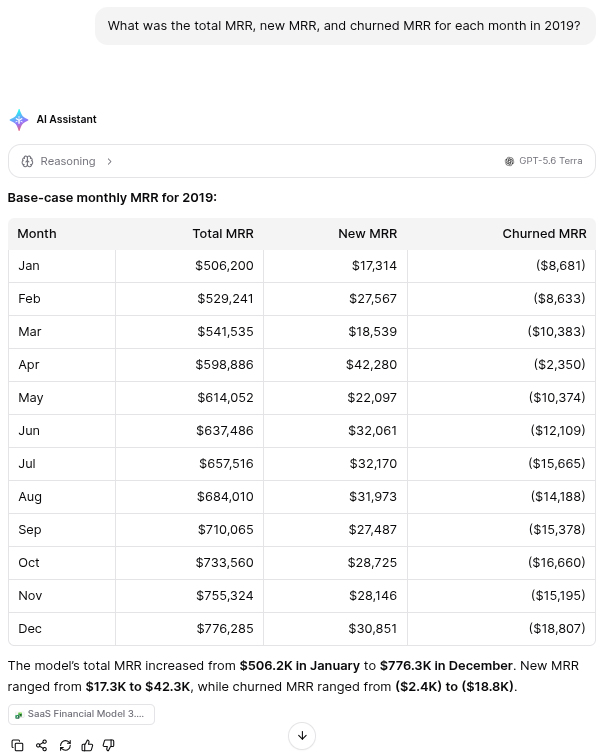
The same schema handles a completely different layout, for example, the Baremetrics Export sheet has conventional columns (date, mrr, mrr_new, mrr_churn) rather than a transposed metric-per-row structure. No code changes; only the sheet name and column positions differ.
What the LLM Sees: Preparing the Visual Sample
The LLM never sees the full file. It sees it in two passes. First, a workbook map lists every sheet with its name, approximate size, header row and top few rows. For large multi-sheet workbooks, the LLM uses the map to choose which sheets the question needs, and only those are loaded. Second, for each loaded sheet, the planner gets a structure string: a visual grid of the sheet's top-left corner and a profile of its columns.
Every SQL query the planner writes is derived from the structure string. If the structure string is accurate, the plan is accurate.
Workbook Map and Sheet Selection
A 40-sheet workbook rarely needs 40 sheets to answer one question. Before anything is parsed, the workflow reads only the top rows of every sheet and builds a workbook map: each sheet's name, approximate cell count, detected header row and column labels. For a small workbook, every sheet is loaded. For a large multi-sheet workbook, one LLM call reads the map and the question and returns the sheets to load: the sheets that hold the answer, plus any lookup, assumption or summary sheets the answer depends on. The response schema only accepts real sheet names, and the chosen sheets must fit within the cell limit. Unchosen sheets are never parsed.
Visual Grid and Column Profiles
The top-left corner of each loaded sheet is pivoted into a grid indexed by column letter and rendered as a markdown table. Cell values are truncated so a single long formula doesn't dominate the sample.
For the Metrics sheet of the sample SaaS model, the grid shows "Metrics - Monthly" in cell A1 and the months 2019-01, 2019-02, 2019-03 and so on across row 1. Column A below it holds metric names such as "Sales & Marketing" and "New Customers", with each month's value in the column under its date. From this, the planner learns that the layout is transposed: metrics run down the rows and months run across. Without the visual grid it would have no way to know this, and would write the wrong kind of SQL.
Alongside the grid, a column profile provides per-column metadata: which row is the header, which row data starts on, a date range hint showing which time periods the sheet covers, and a sample of unique values. The profile reads at most the first few thousand data rows of a sheet; SQL still runs over every row.
Formatting as Columns
In spreadsheets, formatting is often data, not just decoration. A bold row is a header or subtotal to exclude from aggregations. A red cell flags an exception. Font color, background color, bold, italic and hidden flags are extracted at parse time and stored as columns in the EAV table. The planner doesn't guess at color codes: when a question depends on formatting, it first queries which colors a sheet actually uses (SELECT DISTINCT bg_color …), then filters on them. Because this is SQL, it covers every loaded cell, not a sample.
Token Budget
The planner's context has a token budget. This is a deliberate cost and quality limit, not a context-window constraint: a bigger prompt costs more and degrades reasoning on information-dense input. When the loaded sheets don't fit, text is never cut mid-sheet. Instead, the least relevant sheets drop to headers only, then to size only, while sheets the question names stay in full. The planner is told which sheets were summarized, and its SQL still runs over all of their rows and columns.
From Question to Answer: Planning and Execution
With a structure string built, the workflow moves to planning and execution.
Planning: Intent Inference and SQL Generation
Before writing any SQL, the planner infers the user's domain and expands search terms. A query about "net income" triggers synonyms like "net profit," "net earnings," "profit after tax," so the search isn't defeated by the exact wording the file author chose.
The planner produces an ordered list of SQL steps, preferring one comprehensive query over many. Each step declares which sheets its SQL reads, so when a step has to be repaired, the replanner sees only those sheets. If a question needs a sheet that wasn't selected, the scope is never silently widened to the whole file: the planner is told which sheets weren't loaded, and the answer says it covers only the loaded sheets.
The planner is guided by domain knowledge about how enterprise spreadsheets are laid out, such as, transposed layouts, merged group headers, dynamic column discovery.
Extraction and Execution
The file is validated on its size and format before any parsing begins, and the selected sheets are checked against the cell limit using the workbook map's estimates. The parser walks only the selected sheets, producing a raw DataFrame. EAV normalization and typed column derivation then run in an isolated worker, so that a crash or out-of-memory during this CPU-bound step can’t bring down the service or affect concurrent requests.
Each SQL step runs as an independent query with a hard deadline. A runaway query is interrupted cleanly. Result rows are capped before entering the LLM’s context; the full rows are delivered as a separate artifact visible to the UI but never entering the LLM context window.
Replanning and Synthesis
Two failure modes trigger a replan: a hard SQL error, and an empty result, a query that succeeded but returned zero rows. In both cases, the planner receives enough context to correct the query without guessing. A partial answer is more useful than a complete failure.
Once all steps have run, the workflow returns the query results, with a plain description of each step, to the AI Assistant, which writes the final natural-language answer. It sees query results and descriptions, not raw SQL.
SQL vs Python: Why the LLM Writes Queries, Not Code
A common alternative to SQL is giving the LLM a Python execution environment to write pandas or openpyxl code. Here is why we chose SQL instead.
- Schema safety. In SQL, a hallucinated column name fails immediately: spreadsheet_cells has no revenue column. In Python, df["revenue"] fails at runtime, or silently returns the wrong data.
- Sandboxing. SQL queries run against an in-memory table created fresh for each request and discarded when it completes, with no external data sources, no write functions and no extension loading. The query environment is stateless, and the parsed file is never persisted to external storage. Python needs explicit sandboxing, and side effects are possible even with restrictions.
- Failure modes. A failed SQL query returns a structured error the retry loop can act on. Python can fail silently with a plausible-looking wrong answer.
- Arithmetic. In SQL, SUM, AVG and window functions are computed exactly by DuckDB. In Python, the LLM may write calculated numbers directly into the code instead of having pandas compute them, producing hallucinated sums.
The counterpoint: SQL cannot express complex iterative calculations, like IRR, NPV, XIRR and amortization schedules. For financial analysis this is a real gap. The planned solution is DuckDB UDFs: Python functions registered as SQL functions. The LLM would still write SQL, with more functions available. The UDFs would be pure computational functions, with no filesystem or network access, and subject to the same DuckDB constraints as the rest of the query.
Predefined Workflow vs Agent Loop
Teams building LLM tools over large files often face the same architectural question: should the LLM drive the execution loop, or should the code?
What an agent loop would look like for this problem: The LLM calls tools one at a time, for example, list_sheets(), get_headers(sheet), read_range(sheet, A1:Z50), aggregate(col), then observes each result, and decides what to call next. Flexible and demand-driven.
For a specific analytical query, an agent loop calls the LLM N times: once to list sheets, once to read headers, once to read the relevant range, once to aggregate, and each call sends the full growing conversation history as the prompt. The predefined workflow calls the LLM once for planning (plus once more to choose sheets in a large workbook), then executes SQL with no further LLM involvement. That is 3-5x fewer LLM calls, with proportional reductions in latency and cost.
When the loop wins instead. An agent loop wins when the file is so large or unpredictable that no upfront sample gives the planner enough signal. The predefined workflow isn’t universally better; it’s better for the bounded, well-defined task of answering a specific query against a file whose structure fits in the sample.
Production Failures That Shaped the Design
The strategies in the planner prompt didn’t arrive fully formed. Here are some examples of production failures that shaped the design:
Hardcoded column positions return zero rows silently. Early plans assumed a column was always in a fixed position. On files with a blank leading column or merged headers that shift positions, that position points at the wrong data, the query returns zero rows with no error. Fix: the LLM discovers column positions dynamically by scanning header rows for a matching keyword rather than assuming an index.
Merged group headers lose their prefix. Cross-tab tables use merged cells for group labels: "Category A" spans columns B–D but Excel stores it only at column B. A naive header read gives column B its full label but columns C and D lose the group prefix. Fix: Fill-forward to propagate the nearest non-empty cell to the left across each column slot in the header row.
Total rows double-count aggregations. Summing a column that includes a Grand Total row returns twice the correct value, showing no error, just a wrong number that looks plausible. Fix: The planner instructs the LLM to always exclude rows labelled "Total," "Subtotal," or "Grand Total" before aggregating.
Trade-Offs
Every architectural decision in Spreadsheet Analyst has a cost. These are the most significant:
- A missed sheet stays missed, because only the sheets chosen from the workbook map are loaded, and the scope is never silently widened; the answer then states that it covers only the loaded sheets.
- A static plan that can't adapt mid-execution, because one planning call produces a fixed plan; replanning fires only on a SQL error or an empty result.
- No iterative financial calculations, because SQL can't express IRR, NPV or XIRR.
Next Steps
- Domain-specific UDFs. Financial calculations that SQL can’t express, like IRR, NPV, XIRR, and amortization schedules, can be registered as DuckDB UDFs. The LLM still writes SQL; the function vocabulary expands.
- Multi-file analysis. The EAV schema is already file-agnostic. A filename column makes cross-file SQL joins work identically to cross-sheet joins. The hard part is semantic: Two files using different terminology for the same metric require domain-aware normalization, not just fuzzy matching.
Key Learnings
The design of Spreadsheet Analyst follows from one decision: The file stays outside the LLM's context window.
The pattern generalizes beyond Excel. Any large structured file that an LLM needs to reason over, like CSV exports, database dumps, log files, is better served by externalizing it into a queryable store than by loading it into a prompt. The context window is the wrong place for data. It’s the right place for schema, structure, and intent.