
Multivariate Anomaly Detection: Safeguarding Organizations from Internal Threats
The term “internal threat” refers to the risk that somebody from inside a company could exploit a system to cause damage or steal data. Internal threats are particularly troubling, as employees may abuse extended privileges, leading to massive losses for the organization.
One such infamous case is of an ex-Google employee who was charged with theft of trade secrets from Google for a ride-hailing start-up Uber. Before leaving his job, he downloaded more than 14,000 files to his laptop containing critical information about Google’s autonomous vehicle research. He later founded a self-driving truck company which was acquired by Uber in 2018. The concerned employee was eventually sentenced to 18 months in prison. (Reference)
It’s not an isolated incident. Tesla has sued an employee for stealing files from an internal network. Similarly, Shopify has fired 2 employees in the past for stealing basic information about their vendor’s customers.
These threats can hurt an organization in multiple ways:
- Financial losses and regulatory fines
- Compromise of sensitive customer data
- Ruined business reputation
- Disclosure of trade secrets and loss of customer trust
Some internal threats are easier to detect using machine learning than others. For example, when a user deletes or downloads a large number of files. However, many malicious users are savvier and slowly cause damage or steal data over an extended period, making detection more difficult. However, often there are certain signs associated with insider threats that, if carefully observed, can safeguard an organization from such attacks.
Multivariate Anomaly Detection (MAD)
Egnyte helps 17,000+ businesses manage, secure, and govern their cloud content. Multivariate anomaly detection (MAD) on time series data of file downloads detects potential malicious file infiltrations.
MAD detects threats on multiple levels. Key focus points of anomalous behavior detection include:
- Individual user behavior involving increased sensitive file access
- Files access at abnormal times of day
- Files access at unusual locations
Key Terms
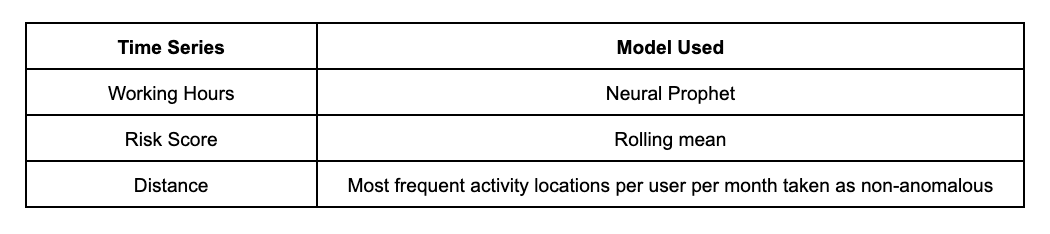
- Risk score: Numeral values allotted to content (emails, files, etc.) to differentiate their level of importance. Based on predefined criteria, files are given a risk score from 1 to 9. These values are used as a feature in the model to gauge anomalous behavior
- Neural prophet: It is a decomposable time series model with components like trend, seasonality, auto-regression, special events, future regressors, and lagged regressors. It is inspired by another model by the name FbProphet. NeuralProphet models time series as piecewise linear trends using change points. Auto regression is modeled using separate feedforward neural networks
Challenges
Anomalies are data points that stand out amongst other data points in a dataset and do not conform to the normal behavior of the data.
However, what is the “normal” behavior of a dataset, and when would we consider a point to “stand out” is highly subjective and depends on the context of the technology/business.
A typical time series representation of file downloads looks like this:
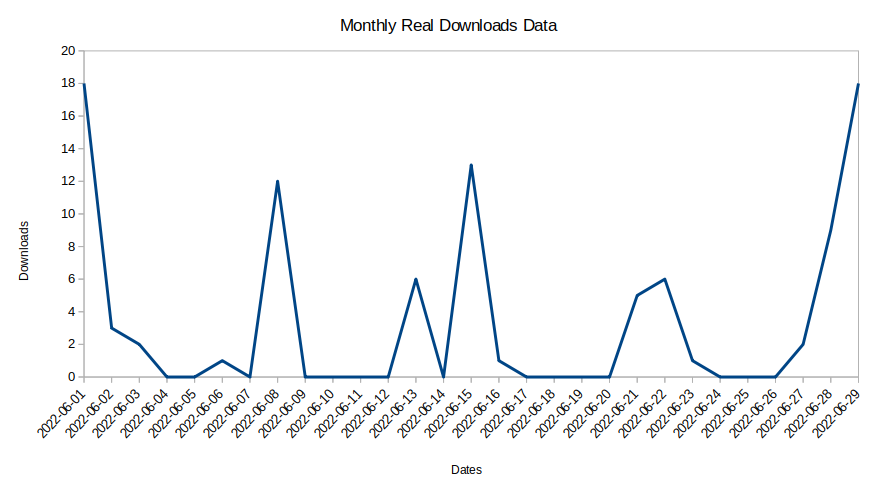
It is difficult to find any key trends in this time series data. The problem further increases as most of the customers’ downloads happen extremely sporadically. As such, a data point that an algorithm marks as anomalous might be entirely normal for that particular user. In another case, a data point associated with data theft may be marked as normal.
Other challenges associated with anomaly detection include:
- Data distribution: When the time series is divided into features like risk score, event type (downloads, deletes, file moves, etc) becomes extremely rare with the majority of value being 0. As such the chances of a non-zero point getting marked as an anomaly increase
- False positives: Lack of availability of ground truths hampers the training process
- Mobile workforce: With the advent of “work from home/anywhere” the range of locations from where events can occur has increased, as such, “location-based” anomaly patterns have changed significantly
Anomaly Detection Approaches
Methods to identify anomalies in a time series can be divided into two types:
- Forecast-based methods: These methods focus on forecasting the time series first, followed by applying criteria like “three standard deviations from the mean” for marking a point as anomalous Forecast-based methods include simple univariate methods like rolling mean to complicated multivariate Neural Network-based models
- Non-forecast-based methods: These methods focus on the data’s temporal/spatial distribution to mark a point as anomalous. Non-forecast-based methods include density-based methods like isolation forest, cluster-based methods like DBSCAN, etc.
For our MAD model, we wanted to choose a method that is not only effective but also easy to explain to our end users. We decided to go ahead with forecast-based methods as they can be easily plotted on a time series and provide an intuitive upper threshold forecast.
Methodology
We identify anomalous events by observing users accessing sensitive files from unusual locations or outside regular working hours.
The following key features were created:
- Time of day (working hour) when the event occurred: we divided working hours into six buckets—starting from working hours 0-4 to working hours 20 to 24
- Tracking distance through the IP address of the event: this feature monitors the usual place from where the event occurs
- Sensitive files: we have multiple models running on each file that rate the file’s content for sensitivity; this is termed as content classification score (risk score). All files are divided into nine classes ranging from risk score 1 to risk score 9, depending upon the sensitivity of the content. These nine classes are taken as a feature
Depending on the feature, time series behavior varies. We chose algorithms that give the best results for the specific feature. The results were measured in terms of Mean Absolute Percentage Error (MAPE ) values of the forecast for the time of the day and sensitivity of the file features:
Based on the time series forecast generated for each feature, upper threshold values were obtained to mark an upper threshold of non-anomalous points. Any point lying above this upper threshold is marked as an anomaly.
Results
The final results generated from the MAD model look like this:
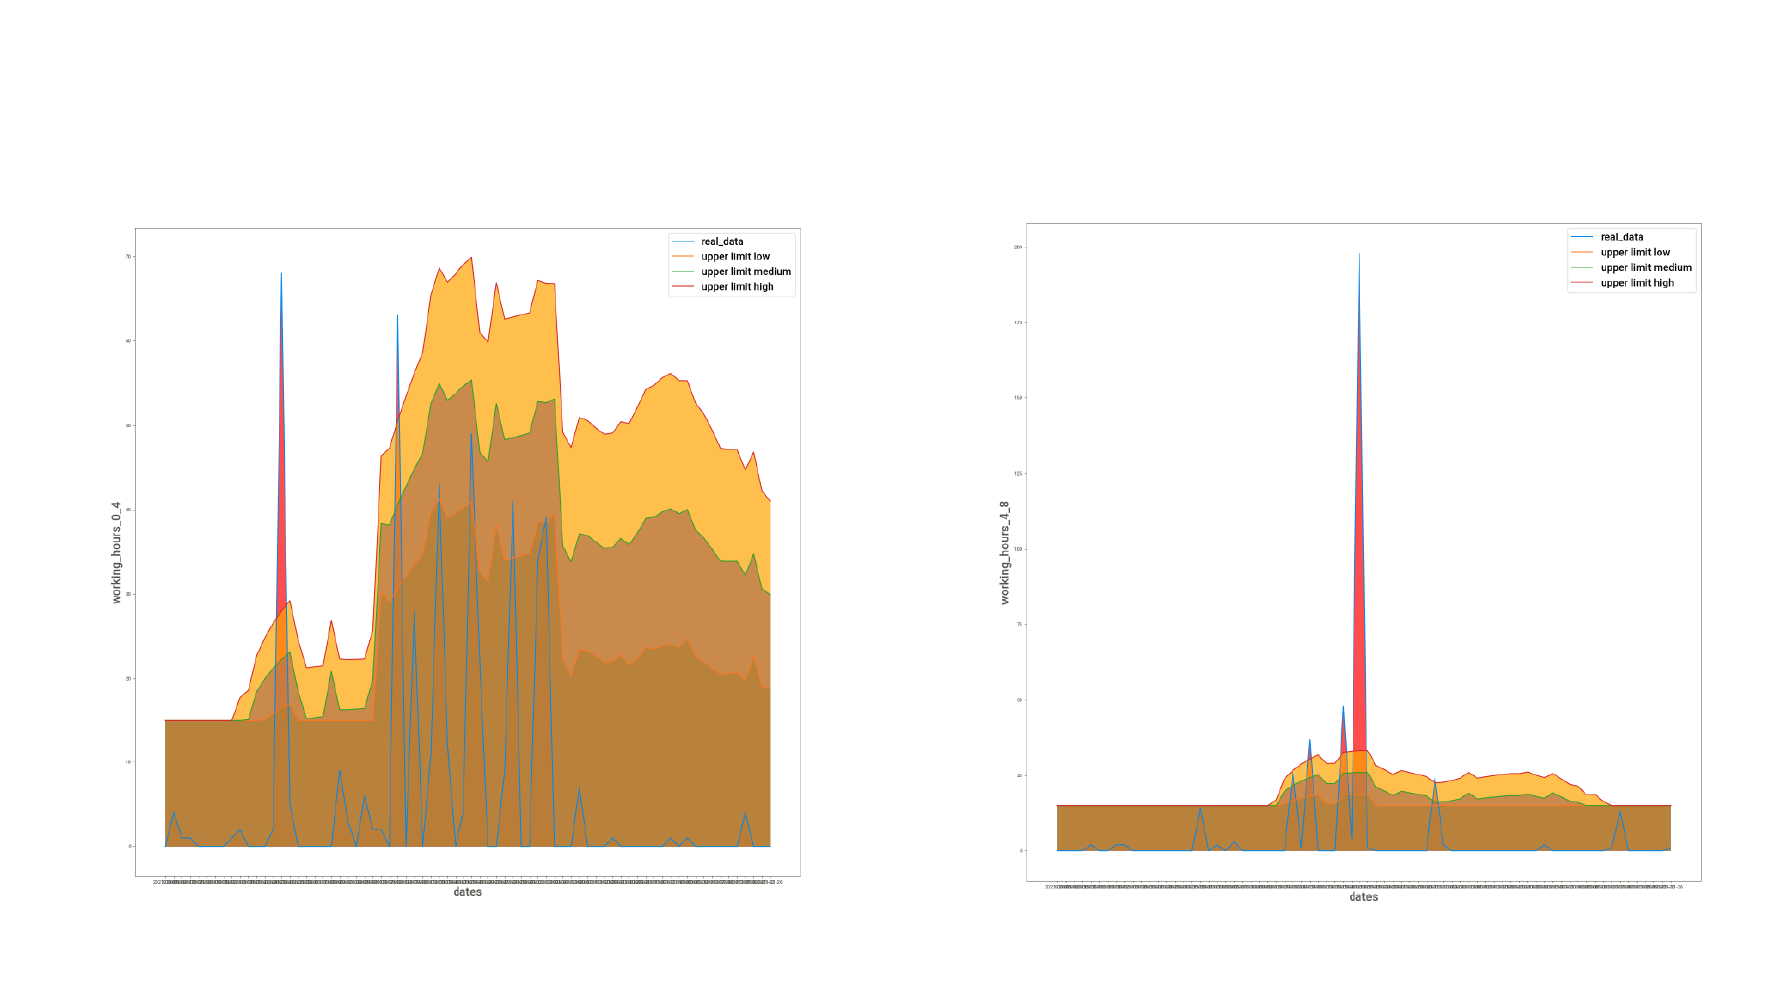
The actual data is marked in blue. Three different levels of thresholds are shown (orange, green, and red). Any value above these thresholds is marked as an anomaly (peaks in the images above).
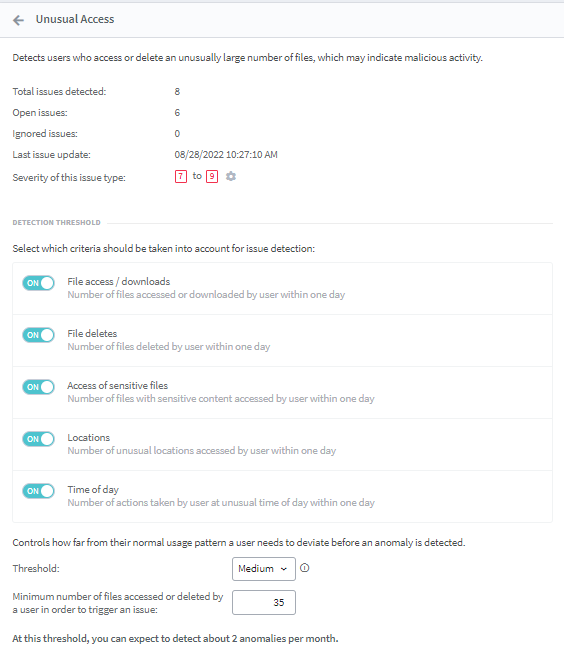
A dashboard is created for the users to observe event behavior patterns in an interactive manner:
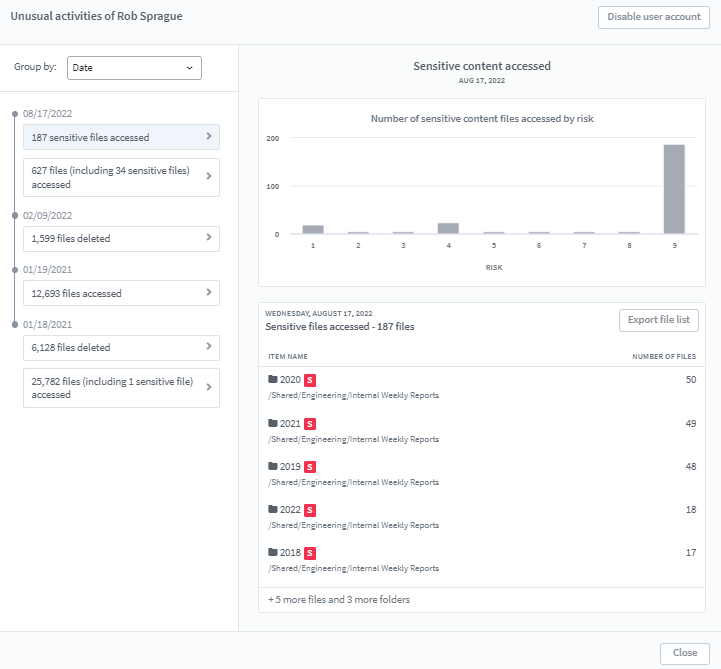
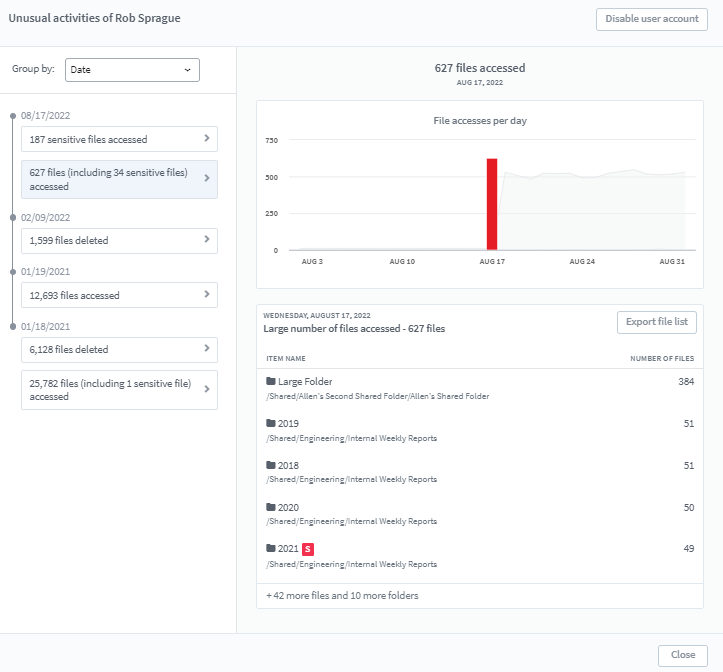
- The dashboard shows the activities of the users
- Users are notified of anomalous activities in the dashboard
- Users have the option to change the sensitivity of any feature (anomalies are detected at low, medium, and high thresholds as per the user’s choice) or to switch on / off any feature they don’t want to be monitored
What’s Next for Egnyte’s MAD?
We’ve explained how Egnyte safeguards organizations from insider threats through MAD Module. We are continuously working on improving the anomaly detection standards.
In the next versions of MAD, we will be working on incorporating features like user groups, file actions, file type, etc. Next, we will be developing a dynamic user profile that would include probabilities of a user to:
1. Access a particular file type or directory
2. Take a particular action on a file
3. Work from a particular location/time of the day
Such profiles have the potential to solve the cold start problem (non-availability of anomalous behavior patterns for new users) and to greatly push forward the limits of possibilities in analytics.