Scaling Elasticsearch at Egnyte
Search is a complex problem on its own, and when you add content indexing to it, it becomes an even more complex problem. When Egnyte started, most open source, distributed search systems were in their infancy or non-existent. At that time, Lucene was the best search library available so we used that as a base to cook up a distributed search solution of our own. Egnyte has been growing quickly over the past few years, and scaling the home-grown distributed search was becoming a painful job for an already busy devops and engineering team at Egnyte.. Last year, we started looking for some alternatives out there. We were looking for a solution that had:
- Replication support
- Elastic scaling
- Auto rebalancing
- No single point of failure
- REST API interface
- Good documentation
- Active community support
- Cluster monitoring tools
Solr and Elasticsearch both fit the bill, but we ended up choosing Elasticsearch as we were already using it as a backbone for Logstash, and our devops team had some experience with it. We started with one engineer Igor and then Deepak was added in middle of project, and one devops engineer Eloy was added later to the project.After Elasticsearch, the new search stack in each data center looks like this:

- 3 ES client nodes (10GB disk, 4CPU, 16GB Memory)
- 10+ ES data nodes (2TB disk, 16 CPU, 60GB Memory)
- 6 text extraction nodes for daily traffic (8 CPU, 8G memory)
- n+ text extraction nodes during the migration phase (teared down after migration)
- 12 indexer nodes. We have 4 zones or pods in a data center, so this is 3 indexer node per pod.
- 80 ES indexes with 10 shards each.
- 1 ES index with 10 shards each for customers with 10M+ files.
- ES Replica count = 1; we will make it 2 once we upgrade to 1.6.0 Elasticsearch that has solved the slow cluster restart issue.
- jdk1.7 and 30G jvm heap for ES data nodes.
- Puppet is used to deploy the entire stack.
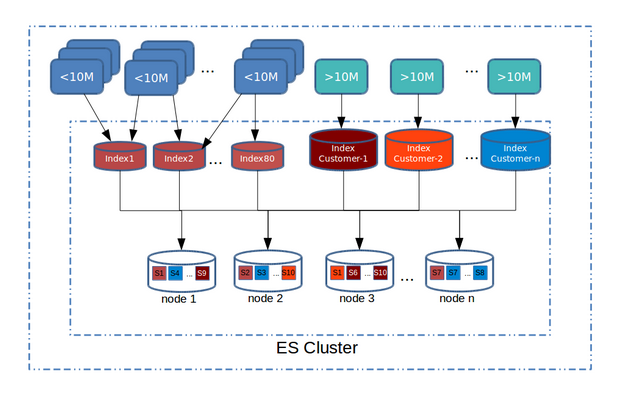
There were some important architectural decisions to be made upfront:1. Number of Elasticsearch clusters: We have multiple data centres, and in each data center, we use a Pod architecture to isolate downtimes in a zone from other zones. After some careful consideration, we decided to stick with one cluster per data center due to the increase in monitoring and management overhead of multiple clusters per data center. We decided against a global cluster for all data centers due to cluster rebalance overhead across the data centers. Also we don’t bring any of the EU data to US data centers.2. Number of indexes/shards: Once you choose the number of shards per index in Elasticsearch, you cannot change it again; this is one decision you have to make upfront. For scaling, if you are really forced to change the number of shards, the only option is to create a new index, remigrate all data and map customers to the new index. Our smallest data center hosts billions of files, and existing customers can add large amounts of data at any time. Even If we create one index with 1000 shards, for example, it would be a ticking timebomb. Search query performance degrades as the number of shards increases because internally Elasticsearch has to fire one query per shard and merge the results. Elasticsearch has a concept called Routing to solve this, where you can pin a customer’s data to a single shard. But all of our customers are not same. We have a lot of customers that have about 1M files, but we also have a lot of customers that have 50M+ files. Pinning a 50M+ customer to a shard means some shards would be fat and some would be thin. This means we might have to pin shards to nodes and scale those nodes vertically. This node management is not fun and was the exact problem we were trying to eliminate with our home-grown system. We wanted a solution that would:1. Manage unpredictable document increases2.Handle large customers without vertically scaling specific nodes3. Deliver consistent search performanceWe ended up selecting a mix of index+shard approach, using the index templates feature. We bootstrapped each cluster with 40 indices having 10 shards each. The migration script and new customer registration code would pin a customer to an index, based on the least number of rows. Halfway through migration, we started seeing load issues on cluster. As we migrated more customers, the migration rate degraded, so we added 40 more indexes using index templates. For customers with >10m files, we created a separate index for each customer. This way a customer with 100M files would have 10 shards with 10M files each, and search query performance would still be good, as you can add more nodes. We haven’t done this yet, but if a 1M customer suddenly becomes 20M and creates “noisy neighbour issues,” then we can write a script that can create a special index for this customer and move the data and switch the pointers to scale.A customer/index/shard distribution at a high-level looks like this:
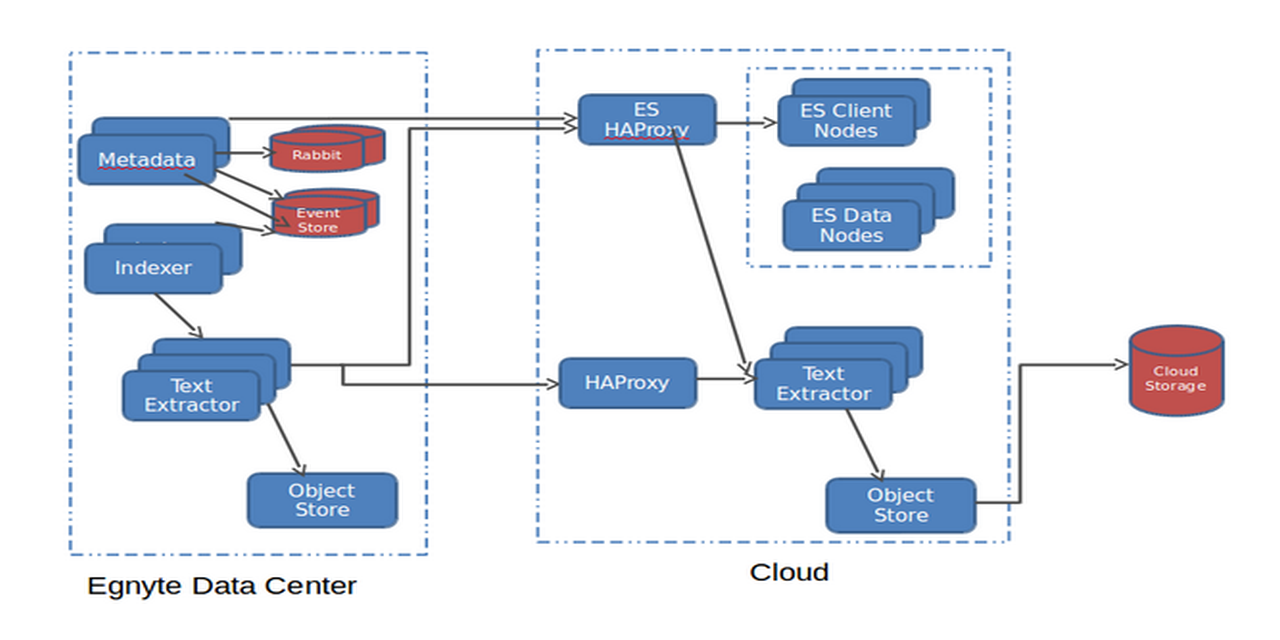
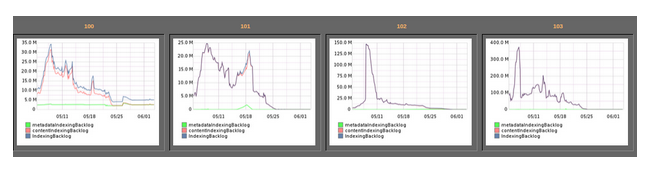
3. Cloud or not: Using your own data center has cost advantages, but as this was a massive project that required rapid experimentation with different hardware configurations, we decided to chose a hybrid deployment here. Our metadata servers are in our data centers and Elasticsearch and text extraction servers are in the cloud. Halfway through migrations, one of the Elasticsearch cluster in cloud showed load symptoms and CPU was the major contributor. We converted 8 CPU nodes to 16 CPU nodes easily as we were in the cloud. So far, normal disks are working fine for us, but we may end up moving to SSDs to see if it helps with node restart times. At some point in the future, we may decide to bring this back in house on bigger physical hardware to reduce the number of nodes to manage, and if it provides cost savings.4. Migrate data from Lucene or reindex: Over the years, our home-grown system had read petabytes of data and extracted text out of documents and then indexed it in Lucene. We didn't want to read and extract that content again. We were ok with reading metadata about files from metadata servers, but not extracting content for full text indexing, as it would require reading petabytes of files from disks and extracting text content from it. This would take some serious time because you can read metadata from about a million files from metadata servers and index it in 15 minutes, but those million files can be 5TB in size and reading it, extracting text and indexing, even with 10-20 threads, can take hours. Unfortunately, in the Lucene-based system, we were analyzing text and storing only tokens. We could have used Luke and reverse engineered those tokens and tried to index them again, but that would have caused search quality issues and no text highlighting in the results. We decided to bite the bullet and reindex petabytes of content again. Ouch!!5. Search data model: Customers wanted to search metadata about folders, files and versions. Elasticsearch has a way to model Parent-Child relationships, but it was making our search queries complex, and we weren't sure it would meet all performance requirements. In the end, we decided to model it the same way we had modeled in Lucene. We have two models in Elasticsearch - Folders and Versions. We denormalize folder/file metadata on versions. This creates interesting scaling issues when a customer moves a folder that has 1M files/subfolders under it. In our metadata backend, this requires only changing a few records, but because we denormalized folder path on versions, this requires you to reindex millions of documents in Elasticsearch. This was a conscious decision to take a hit on writes instead of taking a hit on every search query.6. Permissions model: The decision that had to be made here was to map folder permissions in Elasticsearch or apply them in the application layer. We could have denormalized permissions on search documents, but we decided to stick with applying them in the metadata layer because permission changes on top-level folder and groups can cause us to reindex millions of files per customer, which consumes time. As we apply permission changes in the application layer, it has interesting side effects. Some queries may match 1000s of pages, but after filtering permissions, we could end up with only 200 pages of data. Applying permissions on matched documents can be a costly operation and since our customers expect fast search results, we don't try to calculate the number of documents matched and show page numbers; instead we return results as soon as we are able to fill enough pages to show next/previous pages worth of data.7. Data locality: We had to extract/index text based on data locality. Some files are located only in the cloud, some files are only in Egnyte’s data centers, and some have a copy in both places. To save on bandwidth costs, the indexer determines if there is a copy of the file in the cloud, and then it sends an indexing request to the cloud text extractor, which downloads the file from the cloud, extracting text from it using Tika, and indexes it into ES nodes in the cloud. If there isn’t a copy in the cloud, then the indexer sends the request to the Egnyte data center text extractor node, and then indexes the extracted text to the ES nodes in the cloud. Ingress of data into the cloud is free, so we don’t pay any download bandwidth costs in both cases.Migrating all customers transparently was a big hurdle, and we used concept of feature flags and cloud elasticity to scale it. We had both old and new implementations live in production at the same time. We would halt indexing, migrate metadata for a customer, and then resume indexing. After that, we then would do content indexing in parallel threads as this could take days for very large customers (more details will come in another post). It took 4+ months to migrate all of the customers, though we still have some pending full-text indexing jobs.Monitoring is very important when it comes to doing projects at scale. We ended up using kopf, HQ, BigDesk plugins to monitor Elasticsearch. We also plotted some custom graphs in Graphite to measure the migration progress and content indexing backlog, and to spin more nodes in the data center and tier the nodes down when backlog was over. A month graph of 4 pods in a typical data center looked like this:
There were some Elasticsearch specific issues faced in scaling it at this volume, and we will do a detailed post in coming months on how we overcame those issues.Even though we faced many obstacles in this journey, we believe that search has came a long way at Egnyte. We are able to deliver good quality search results, improve search and indexing performance, became more fault tolerant and are better at managing our search infrastructure. From our proactive exception analysis reports, we can see that the number of search timeouts have reduced and out of memory errors have disappeared. We believe our customers will benefit from these changes.